America's Economy Landscape: State by State 📊
Uncovering Cost of Living, Salaries and Housing Prices
Welcome back, folks! As a fresh week begins, we're embarking on an exciting journey to analyze the economic landscape of American states. We'll explore three key factors: the cost of living, average salaries, and housing prices. These insights offer a comprehensive view of each state's economic well-being. Let's dive right in!
Cost of Living by State
The chart below offers an in-depth analysis of the cost of living in different states. To gain a clear understanding, we turn to the Cost of Living Index (COLI). The COLI can be defined as a statistical measure that enables us to compare the relative expenses associated with living standards across various regions within a state, country or geographical area, according to WallStreetMojo.
Hawaii secures the top spot with an astounding COLI of 179, signifying that it's the most expensive state to call home. On the flip side, Mississippi boasts the lowest COLI at 85.3, indicating a cost of living that's 14.7% below the national average. As we delve into these variations, keep in mind that the unique economic landscapes of each state contribute significantly to these numbers.
Average Salary by State 💰
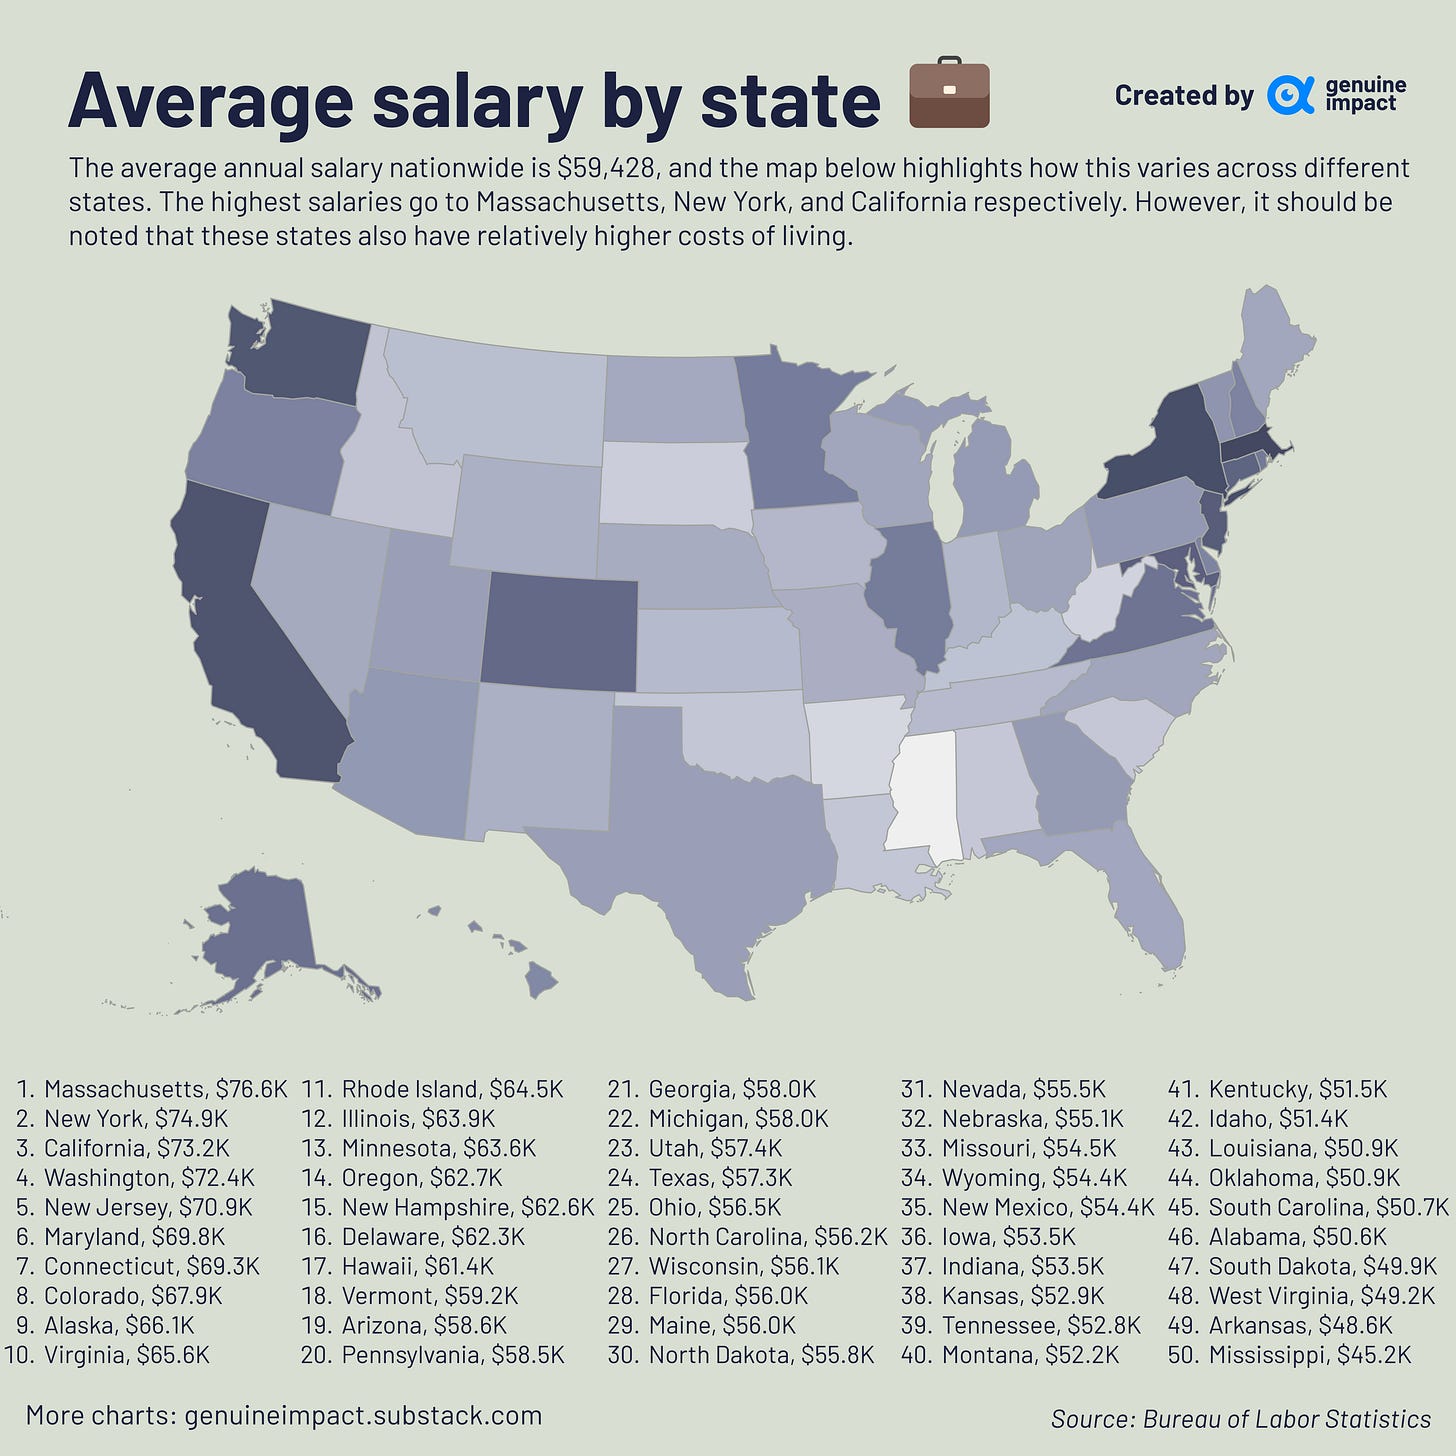
Now, let's turn our attention to the income side of the equation. The map below showcases the average annual salaries across different states. This metric paints a vivid picture of income disparities throughout the nation.
Nationally, the average annual salary stands at $59,428. However, this figure varies significantly from state to state. The highest salaries are found in Massachusetts, New York, and California. These states offer lucrative opportunities but are also known for their relatively higher costs of living. This balance between income and living costs shapes the economic landscape across regions.
News Without Motives.
1440 is the daily newsletter helping 2.6M+ Americans stay informed—it’s news without motives, edited to be unbiased as humanly possible. The team at 1440 scours over 100+ sources so you don't have to. Culture, science, sports, politics, business, and everything in between - in a five-minute read each morning, 100% free.
*This is sponsored advertising content.
House Prices by State 🏠
Exploring the realm of real estate economics, we delve into the fascinating world of housing prices across the states. The chart below unveils a map showcasing house prices by state.
As of Q2 2023, the median home price across the United States averaged $416.1K. However, the variation from state to state is striking. Take, for instance, the picturesque state of Hawaii, where the typical home value soars to a staggering $966.6K. Compare this to the more modest West Virginia, where the average home is valued at just $155.7K. This means that living in Hawaii can cost you more than six times as much as residing in West Virginia.
This significant divergence in housing prices underscores the diverse economic landscapes across the nation and highlights the challenges and opportunities facing prospective homeowners.
As we conclude our exploration of America's economic landscape, remember that each state brings its unique strengths and challenges to the table. By understanding these economic nuances, we gain valuable insights into the intricate web that shapes the nation's prosperity.
See you on Wednesday!


Are you planning to do something similar for Canada?