

The Slow-Motion Run
What $14 billion of queued redemptions says about the $2 trillion private credit machine.

A run used to be a crowd on a pavement. In private credit it happens by appointment: investors file their withdrawal requests, the fund pays out 5% of net assets, and everyone else joins the back of a queue that re-forms every ninety days. By the start of July, that queue held more than $14 billion, and the second-quarter letters just released showed it lengthening rather than clearing.
This issue takes the queue seriously as evidence. The redemption wave has been dismissed as sentiment and defended as design, and both descriptions contain truth. But a queue is also an information mechanism. For a decade, semi-liquid private credit funds reported returns that were smooth because nothing forced a price discovery. Withdrawal requests are the first sustained event that asks what these portfolios are worth to someone who wants cash rather than carry. Below, we walk through how a run unfolds in slow motion, what the yield being defended was actually made of, why the marks now matter more than the defaults, who else is standing in the room, and what would make us change our reading.
I. Anatomy of a Slow-Motion Run
The vehicles under pressure are the semi-liquid wrappers of the wealth channel: non-traded BDCs, interval funds and tender funds, which together hold roughly $550 billion, about a quarter of the industry. Definitions matter here: counts limited to the retail funds alone run closer to $300 billion, and this piece uses the wider wealth-channel measure throughout. They were engineered to square a circle: private loans that take years to mature, sold to wealth clients who expect to be able to leave. The answer was the quarterly cap, typically 5% of net assets. As long as requests stay below the cap, the fund feels liquid. Once they exceed it, the arithmetic inverts, because anyone who waits risks standing behind everyone who didn’t.
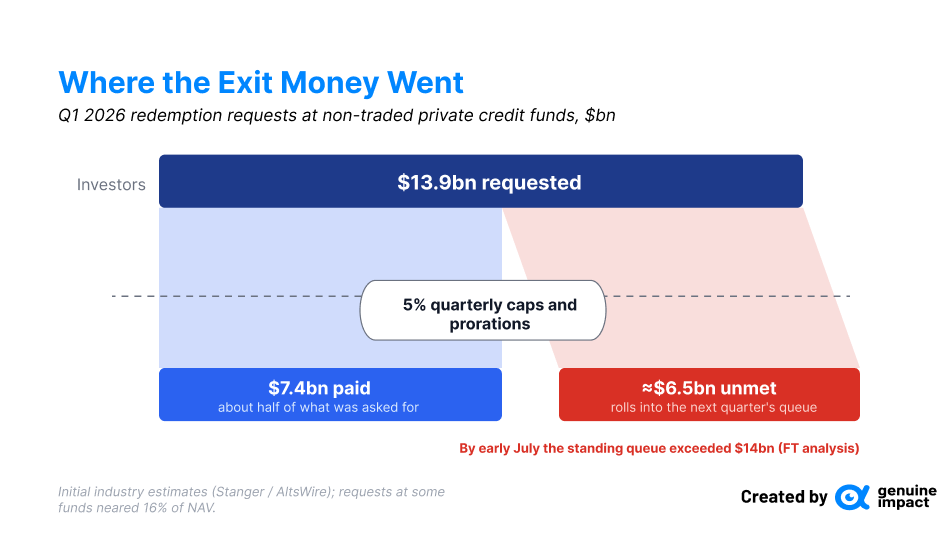
That inversion arrived in stages. Redemption activity at non-traded BDCs roughly tripled in the fourth quarter of 2025, and five funds honoured tenders above their caps. In February, Blue Owl froze withdrawals from its flagship wealth fund and moved to wind it down. In the first quarter, investors asked for roughly $13.9 billion and received about $7.4 billion, with requests at some large funds running near 16% of net assets, and for the first time on record the sector handed back more money than it raised. The second-quarter letters released on 2 July confirmed the pattern is compounding rather than passing: requests across the large funds topped $22 billion, the median fund saw withdrawal requests near 9% of assets, and less than 40% of the money asked for came back, though at a handful of funds the request rate edged down from the first quarter’s peak. Each fund honouring its cap behaved exactly as its documents describe. The gates are holding; that was never the question. The question is what the people inside them now believe, because a rational investor who merely suspects others will redeem is already better off redeeming first. That is the run dynamic, stretched over quarters instead of hours.
II. What the Yield Was Made Of
The product sold into the wealth channel promised roughly 10% distributions from senior secured lending. The composition of that yield deserves more attention than the headline ever received. Public BDCs now take around 8% of their investment income as payment-in-kind, interest added to the loan balance rather than received in cash. An estimated 40% of private credit borrowers run negative free cash flow, up from about a quarter in 2021. A distribution funded while a growing share of the book accrues rather than pays is a distribution with a timing mismatch built into it.
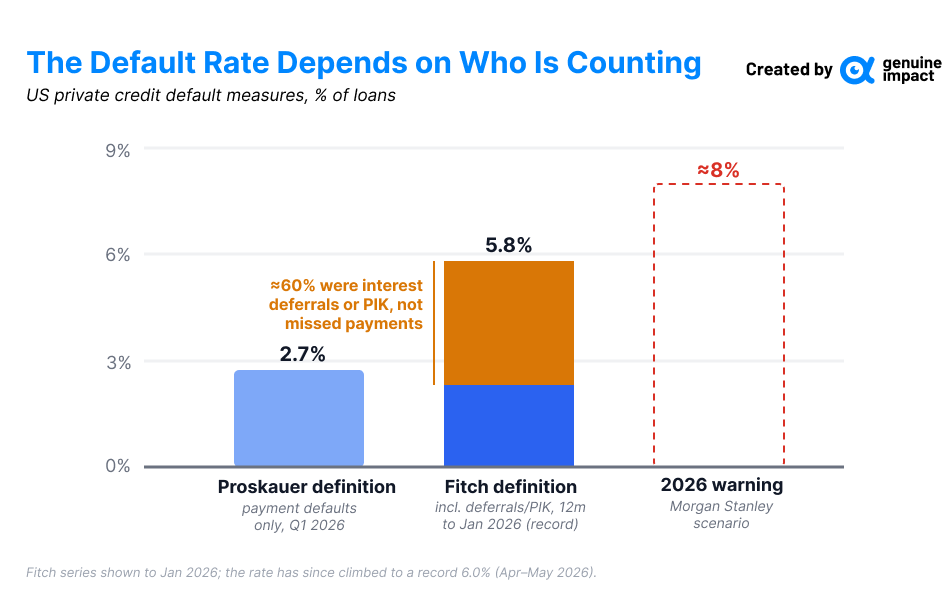
The default statistics carry the same ambiguity. On the narrow definition, private credit looks placid: the Proskauer index recorded 2.73% in the first quarter, low by any historical standard. Fitch’s broader measure, which counts interest deferrals, maturity extensions and conversions to PIK as the credit events they economically are, reached 5.8% for the twelve months through January 2026, the highest since the series began, and has since climbed to a record 6.0%. Roughly 60% of the events in the year to January involved interest not being paid in cash, with distressed maturity extensions dominating the months since. Morgan Stanley has warned the figure could approach 8% under weaker conditions. Between 2.7% and 6.0% sits the entire debate, and which number you believe determines whether the queue looks like panic or like pattern recognition.
III. The Marks Now Matter More Than the Defaults
In a listed fund, an anxious investor sells at whatever the market will pay, and the damage is theirs. In a semi-liquid fund, the exit price is the net asset value, and the net asset value is an estimate produced inside the manager. That arrangement was tolerable while flows were positive, because nobody’s exit tested it. It becomes the load-bearing wall of the entire structure once redemptions are being paid out at the marks.
The strains are visible. Valuations across managers are diverging, with NAVs increasingly reflecting each firm’s own assumptions rather than anything resembling a shared clearing price. One large BDC wrote its NAV down 9.9% in a single quarter. The amend-and-extend toolkit, covenant resets, maturity extensions, PIK toggles, sponsor top-ups, allows a troubled loan to remain marked far above where a sale would clear, and senior figures inside the industry itself have publicly questioned whether the marks are right. None of this proves the marks are wrong. It proves they are untested, and the redemption queue is the test. If the valuations ultimately prove optimistic, every dollar paid out at NAV transfers value from the investors who stay to the investors who leave, which is one more reason the rational move is to leave.
IV. Who Else Is Standing in the Room
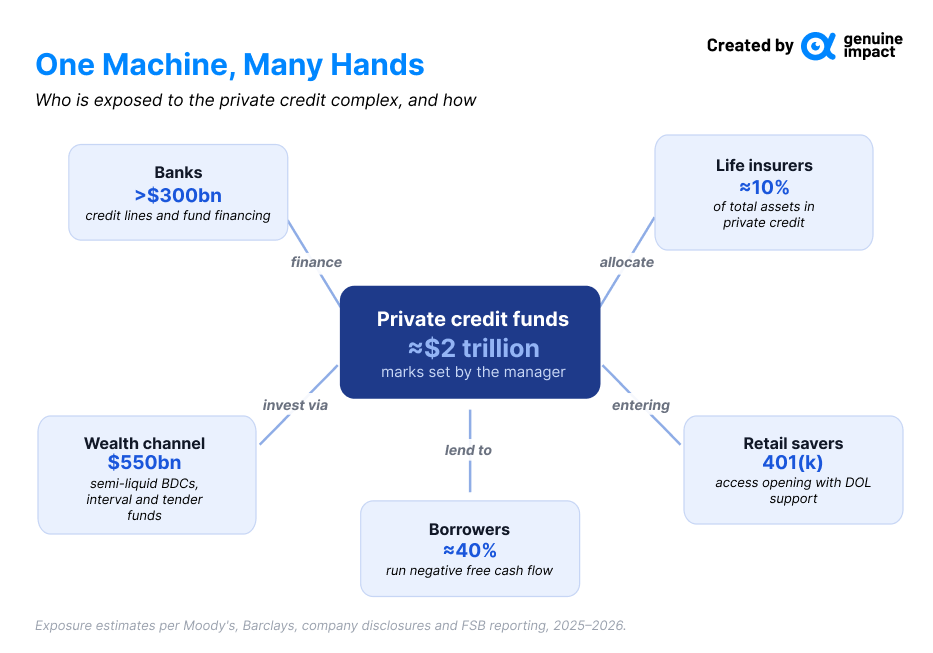
If the stress stayed inside the wealth channel, it would be a product failure rather than a market event. It does not stay inside. US banks have extended more than $300 billion in credit lines, warehouse facilities and fund financing to the private credit complex; Deutsche Bank's disclosure of $30 billion of exposure in March was enough to knock its own share price, and the Federal Reserve has formally queried the major banks on theirs. Life insurers, hunting duration and yield, lifted private credit to roughly a tenth of total assets in 2025, and above 15% at the platforms affiliated with the large alternative managers. And the newest arrivals are the least equipped: partnerships now route private credit into 401(k) managed accounts with the Department of Labor's blessing, opening the mass-retirement channel at precisely the moment existing holders are queuing to exit. The pathway matters as much as the exposures. If redemptions stay elevated, managers hold cash rather than write loans; if marks slide, banks tighten the financing lines the funds run on, and insurers and wealth platforms trim allocations. The realistic contagion channel is not a sudden wave of defaults but a gradual withdrawal of credit from the mid-market companies that now depend on these lenders, arriving through many small decisions rather than one large one. The Financial Stability Board's May report grouped the vulnerabilities into four clusters, bank interconnections, borrower quality and valuation opacity, liquidity mismatch, and data gaps, and conceded on the last point that nobody can currently size the problem. A risk nobody can measure is not the same as a risk nobody is carrying.
V. The Case for Calm
An honest reading has to give the defence its full weight, because parts of it are strong. The caps are not emergency improvisations; they are disclosed design features doing the job of protecting remaining investors from forced sales. The non-traded BDCs run materially less leverage than their listed peers, roughly 0.7x debt-to-equity against 1.1x, with fat asset-coverage cushions. Fitch attributes the request wave chiefly to sentiment, specifically the fear that AI erodes the software borrowers that grew to nearly a fifth of direct-lending books, rather than to observed credit deterioration, and notes that PIK levels were flat in the first quarter. The Federal Reserve’s own stability report called the redemption risk limited and manageable. The precedent is genuinely reassuring: non-traded REITs went through the same cycle in 2022 and 2023, capped, gated, vilified, and then stabilised and re-attracted capital. And even a crisis-grade outcome has bounded arithmetic: applying financial-crisis default and recovery rates to a $2 trillion market implies losses in the low hundreds of billions, painful but an order of magnitude below 2008’s credit losses.
The rejoinder is narrower than the defence, but it is the one that matters. REIT NAVs rested on buildings that could be appraised and sold; BDC NAVs rest on bespoke loans to leveraged companies, and hold up only as well as those borrowers’ cash flows. The defence establishes that the system can absorb the losses. It does not establish what the losses are.
VI. What Would Change Our Mind
Three developments would move us off this reading, in either direction. If request volumes fall back toward the caps over the next two quarters, the sentiment explanation wins and this becomes the REIT episode replayed, a stress test passed. If, instead, the amend-and-extend cohort begins converting into realised losses that land close to the current marks, the valuation machinery is vindicated at the moment of maximum doubt, which would be the single most bullish datapoint the asset class could produce. And if the retail expansion pauses, if the 401(k) rollout slows or regulators condition it on independent valuation, the industry will have conceded that the wrapper, not the lending, was the weak joint. We would treat any of the three as decisive; what we will not treat as decisive is another quarter of smooth marks, because smoothness is the property under examination.
VII. The Question That Remains
Private credit's core trade still works: patient capital holding loans that banks no longer want is a durable, validated business, and nothing in the current stress contradicts it. What is being tested is an add-on the business did not need, the promise that an eight-year loan could live comfortably inside a ninety-day exit. For a decade that promise cost nothing, because nobody asked to leave at the same time. Now they are asking, politely, quarter after quarter, and the industry is discovering what liquidity promises always were: cheques written against a future in which nobody cashes them together. The queue is the market's way of asking to see the money. The next two reporting seasons will show whether it is there.
Sources verified early July 2026. Redemption and flow data from Fitch Ratings, Robert A. Stanger & Co., and manager disclosures as reported by Bloomberg and trade press; default measures from the Proskauer Private Credit Default Index and Fitch Ratings; PIK, leverage and borrower cash-flow data from BDC filings and rating-agency analysis; exposure figures from Moody's, company disclosures and Federal Reserve materials; regulatory context from the Financial Stability Board's May 2026 report, the Federal Reserve's May 2026 Financial Stability Report, and Department of Labor guidance. Fund-level figures change quarterly and should be verified before publication.
This information is for guidance purposes and may become out of date at any given time. It is not investment advice. Investments can rise and fall in value. Genuine Impact won’t make any assessment of whether the investments you choose are appropriate or suitable for you. If you are unsure of the suitability of any investment, investment service or strategy, you should seek independent financial advice. Past performance does not indicate future results. Your capital is at risk.
Love what you’re reading? Share this newsletter with your network and help them stay ahead of market trends. 💼📈
Keep in touch with Genuine Impact!
Instagram | X/Twitter | LinkedIn
Created by Isabelle Wang