

The Limits of Performance Persistence
Short-run persistence among active fund managers looks real. Stretch the window and it vanishes. The pattern that holds is at the other end.
S&P Dow Jones Indices published its US Persistence Scorecard for year-end 2025 in May. It opens with the number everyone quotes: 79% of active large-cap US equity funds underperformed the S&P 500 during 2025, against 65% in 2024, the fourth-worst showing for the category in the 25-year history of the SPIVA scorecards.
That figure gets argued over and forgotten, and it deserves to be. It measures one year against one index. It does not tell you whether strong relative performance lasts, which is a different question, and the one a selector actually faces.
The Persistence Scorecard is built for that second question, and it approaches it in a specific way worth stating up front: it ranks active funds against their active peers, not against a benchmark. A fund holds its top-quartile place by staying ahead of other funds in the same category. So nothing below is evidence that these managers beat the market. It says only whether a high rank among peers tends to last.
The report is the part almost nobody reads. This issue is about what its tables say.
I. Two years looks like persistence
Start with the genuinely encouraging part, because this year there is some.
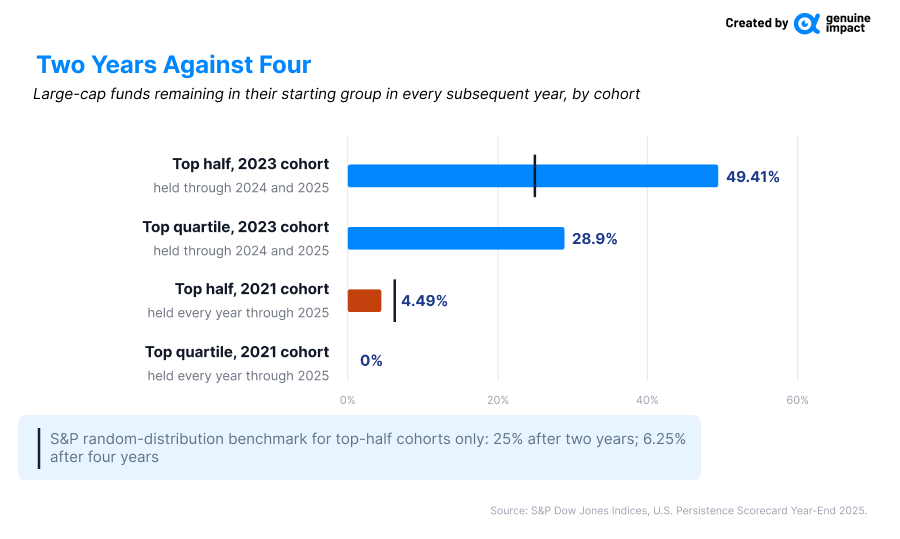
Of the 173 active large-cap funds that finished 2023 in the top quartile of their category, 75.7% were still there a year later and 28.9% were still there at the end of 2025 — having held the top quartile in each of the two subsequent years, not merely arrived back there. The equivalent figure in the previous scorecard was zero.
Widen the bar from top-quartile to top-half and it holds up better still. Of 338 large-cap funds in the top half in 2023, 49.4% were still in the top half at the end of 2025, against the 25% S&P states would be expected by random chance.
Roughly double the random rate, sustained across two consecutive years, in the largest category S&P covers. If the story ended there, the evidence for persistence would look meaningful
II. Four years does not
It does not end there. Extend the window and the result inverts.
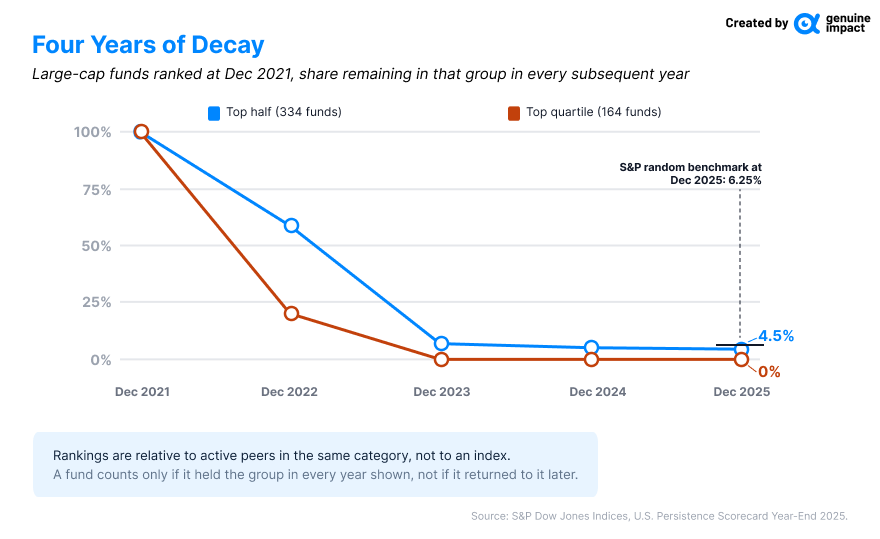
Report 2 tracks the cohort ranked at the end of 2021 across five consecutive twelve-month periods — the ranking year plus the four that followed. Of the 164 large-cap funds that started in the top quartile, 20.1% held it through 2022. Through 2023, the figure was zero, and it stayed at zero through 2024 and 2025. Across every reported active domestic equity category except small-cap, not one top-quartile fund from 2021 was still top-quartile at the end of 2025.
Lower the bar all the way to simply staying above the median every single year. Of 334 large-cap funds that began in the top half, 58.7% survived the first year, 6.9% the second, 5.1% the third and 4.5% the fourth. S&P states that a purely random outcome would produce 6.25%. The observed figure sits below it.
S&P’s own reading is in the report: for large-cap funds the result was less than a random distribution would suggest, which it treats as evidence that active outperformance, where it occurs, tends to reflect luck rather than skill.
Small-cap is where the exception lives, and it is worth being precise about which cohort is which. Of the 128 small-cap funds in the top quartile at the end of 2023, 17.2% were still there two years later, up from 6% in the previous scorecard. That is the short window. Of the 124 small-cap funds in the top quartile at the end of 2021, 2.4% were still there at the end of 2025. That is the long one.
Fixed income behaves the same way. Of the 36 top-quartile Investment Grade Intermediate funds from 2023, 30.6% held rank through the next two years, and 9.5% of the 42 High Yield funds managed it. Run the same test on the 2021 cohorts — holding the top quartile in every subsequent year, not merely returning to it — and retention falls into single digits in every reported active fixed income category, from 8.6% in Investment Grade Intermediate down to 2.4% in High Yield.
III. The pattern that does hold
Now the finding that reframes the rest.
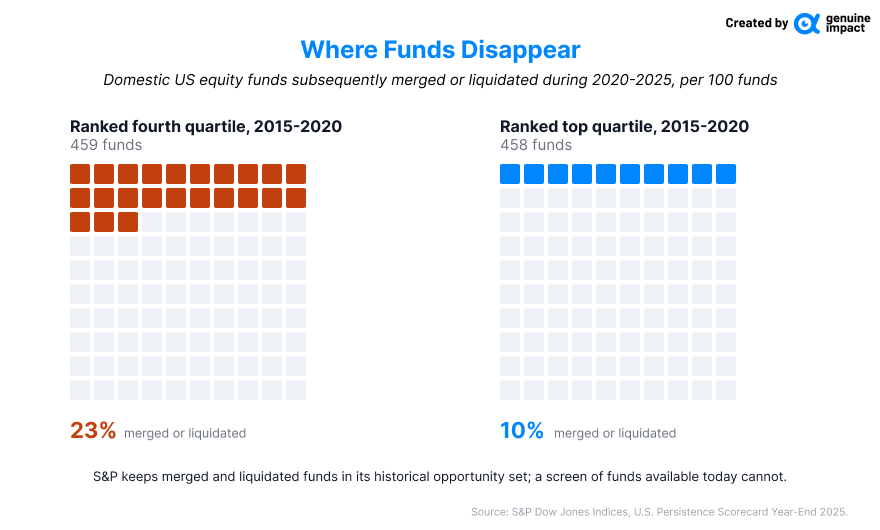
The most consistent pattern sits at the bottom, and it is not that poor performance repeats. It is that the worst performers are the most likely to disappear. Report 5 ranks funds on their performance over the five years to December 2020, then observes what became of them over the five years to December 2025. Among domestic US equity funds ranked in the fourth quartile over the first period, 23.1% of 459 funds had merged or liquidated by the end of the second. Of the 458 funds ranked in the top quartile, 9.8% had.
A further 26.6% of that fourth-quartile group changed style. Between closure and reinvention, roughly half of the worst performers stopped being comparable to what they had been. A style change does not end a fund; it moves it out of the category it was being judged in, which for a category screen amounts to much the same thing.
This matters for anyone looking at funds that exist today. Any category screen of funds currently available has already been reshaped by closures, mergers and style changes, and that reshaping falls hardest on yesterday’s worst performers — not because anyone assessed them, but because the manager shut them or repurposed them.
It is important to be exact about what this does and does not say about the scorecard itself. S&P’s data is not the thing being tidied. The Persistence Scorecard runs on the University of Chicago CRSP Survivorship Bias Free Mutual Fund Database, and the report states the reasoning directly: every fund available at the time of a decision belongs in the initial opportunity set, and ignoring the ones that later liquidate or merge biases any measurement of persistence. The scorecard ranks all funds available at each point and keeps tracking them.
So the 23.1% is not a flaw in the research. It is the research showing you why survivorship correction is necessary in the first place, and quantifying what a naive look at surviving funds would miss.
IV. What the methodology does and does not establish
Two common objections to this kind of study are already answered inside the report, and it is worth knowing which.
Survivorship is handled explicitly, as above. Universe hygiene is too: index funds, sector funds and index-based bull or bear funds are excluded, and where a fund has multiple share classes only one is counted, so a single strategy cannot appear several times.
Benchmark mismatch — the objection that a fund is being measured against an index it never tried to track — does not bite here either, but for a structural reason rather than a methodological fix. The persistence tables are peer-relative. A badly chosen index cannot explain why a fund that ranked in the top quartile of its own category failed to stay there against those same peers.
What the data does not establish is why rankings decay. Relative position can persist or collapse because of style exposure, market regime or fee level as much as manager ability, and the report does not decompose it. The narrow conclusion is the one the tables support: recent relative rank, on its own, has been a weak predictor of sustained relative rank over longer horizons.
The report’s own framing of the point most readers skip: past performance is no guarantee of future results. Here that is not boilerplate. It is the finding.
V. What this changes about selection
Treat a two-year record as thin evidence.
For large-cap top-half funds, two-year persistence ran well above S&P’s stated random benchmark, while four-year persistence fell below it. Recent ranking is therefore weak information on its own. What a ranking cannot tell you — process, capacity, constraints, fee — is where the signal has to come from.
Ask what happened to the funds no longer in the table.
Any list of available funds has been reshaped by closures, mergers and style changes, and that reshaping runs hardest on the worst performers. A record compared only with peers still available today can therefore look stronger than a comparison that retains the funds that disappeared.
Judge persistence against the right null.
Not zero. Under S&P’s uniform random distribution benchmark, 6.25% of an initially above-median cohort would be expected to remain above median in each of the next four years. Large-cap funds delivered 4.5%. On this specific test, observed persistence came in below what randomness alone implies. That is a statement about this test, not a general verdict on whether fund selection can add value.
None of this argues for abandoning active management. It argues for requiring a reason beyond the track record. Where the case rests on something structural — an enforced capacity limit, an asset class where the index is genuinely hard to replicate, a fee low enough that the hurdle is small — the persistence tables are not the relevant evidence. Where the entire case is a strong recent ranking, they are.
VI. The bottom line
Whether most funds beat the index last year is one question. Whether the funds that ranked highly against their active peers can hold that standing is another, and the 2025 Persistence Scorecard answers it with striking short-run persistence and almost none over the longer sequence: 4.5% of the 2021 above-median large-cap cohort stayed above median in every subsequent year, below the 6.25% a random distribution would produce.
At the other end, funds ranked in the fourth quartile over the five years to 2020 were more than twice as likely to merge or liquidate over the following five years as funds ranked in the top quartile. The stronger pattern in this scorecard is not that winners keep winning. It is that losers disproportionately disappear.
The same shape appears in S&P’s regional SPIVA scorecards. Its MENA report gives a 44% ten-year survival rate for active MENA equity funds; its New Zealand report finds 16% of funds merged or liquidated over ten years and 47% over fifteen.
VII. Genuine Impact partners with Foundermatcha
We’re proud to announce a strategic partnership with Foundermatcha, an AI-powered platform matching startup founders with vetted engineers based not only on skills, but also on compatibility across vision, values and personality.
Built with input from Oxford and London-based researchers, recruiters and serial founders, Foundermatcha is supported by a growing network that includes Oxford University, Haatch, SpeedInvest, Simon Squibb, Google, and investors with backgrounds at BlackRock, Microsoft and eToro. Foundermatcha has now opened part of its pre-seed crowdfunding round to its early users and selected partner communities, including Genuine Impact. Click here to watch a video on how Foundermatcha is changing the nature of startup team formation. Click here to learn more about the investment opportunity.
This information is for guidance purposes and may become out of date at any given time. It is not investment advice. Investments can rise and fall in value. Genuine Impact won’t make any assessment of whether the investments you choose are appropriate or suitable for you. If you are unsure of the suitability of any investment, investment service or strategy, you should seek independent financial advice. Past performance does not indicate future results. Your capital is at risk.
Love what you’re reading? Share this newsletter with your network and help them stay ahead of market trends. 💼📈
Keep in touch with Genuine Impact!
Instagram | X/Twitter | LinkedIn
Created by Isabelle Wang